Magellan Strategies Survey Results
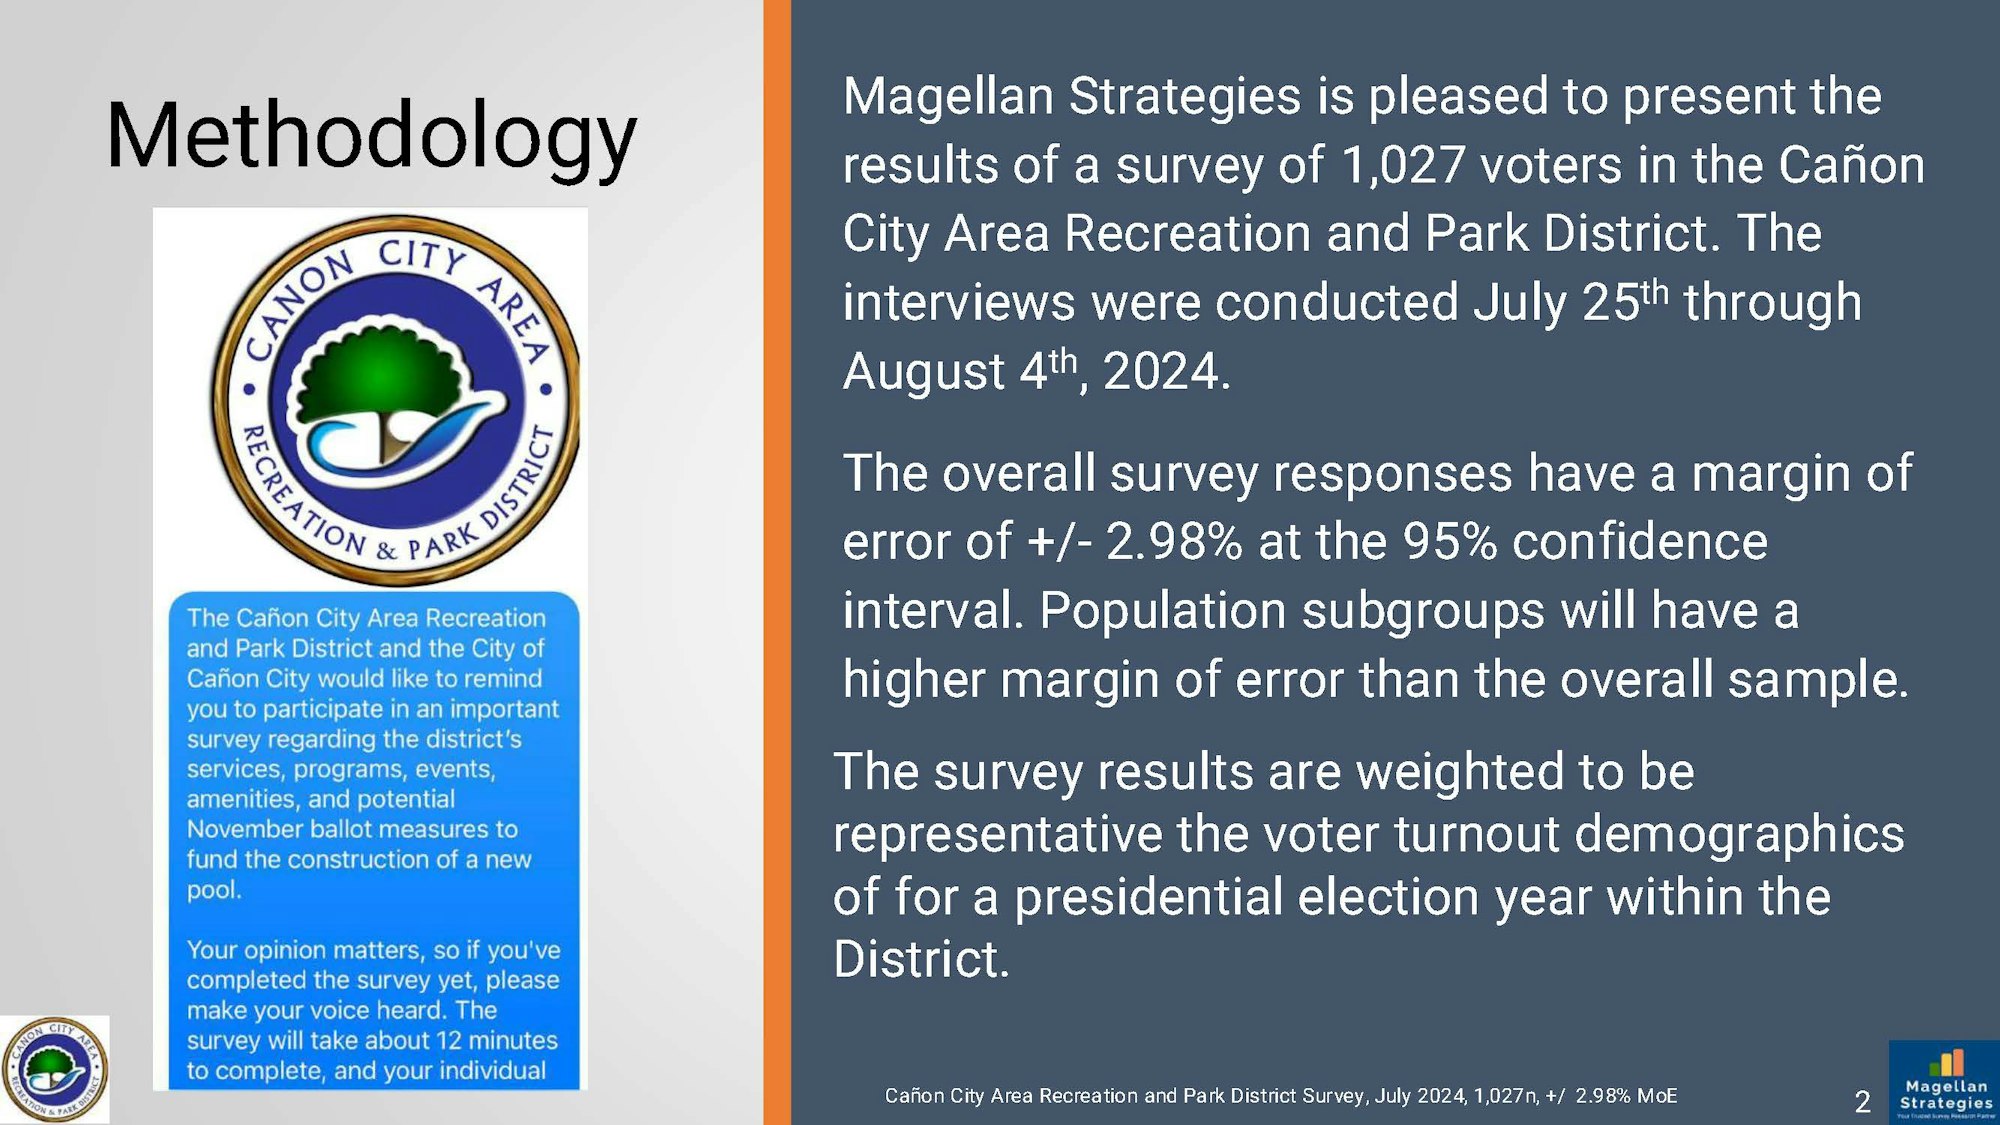
From July 25, 2024 through August 4, 2024 Magellan Strategies conducted a survey for the Cañon City Area Recreation and Park District to gauge the communities' thoughts on the pool replacement project being on the November ballot. The goal was to test the opinion of registered voters within the boundaries of both the City of Cañon City and the Recreation District. The survey asked questions about the work the Recreation District has done through the years, different versions of the pool project, and the tax impacts of the options. The survey was done scientifically, meaning the results had to meet the demographic makeup of the voting community. The demographics are shown at the end of the report. Ballard*King conducted the market analysis for the feasibility study and confirmed the survey indeed met the voting demographics of the community.
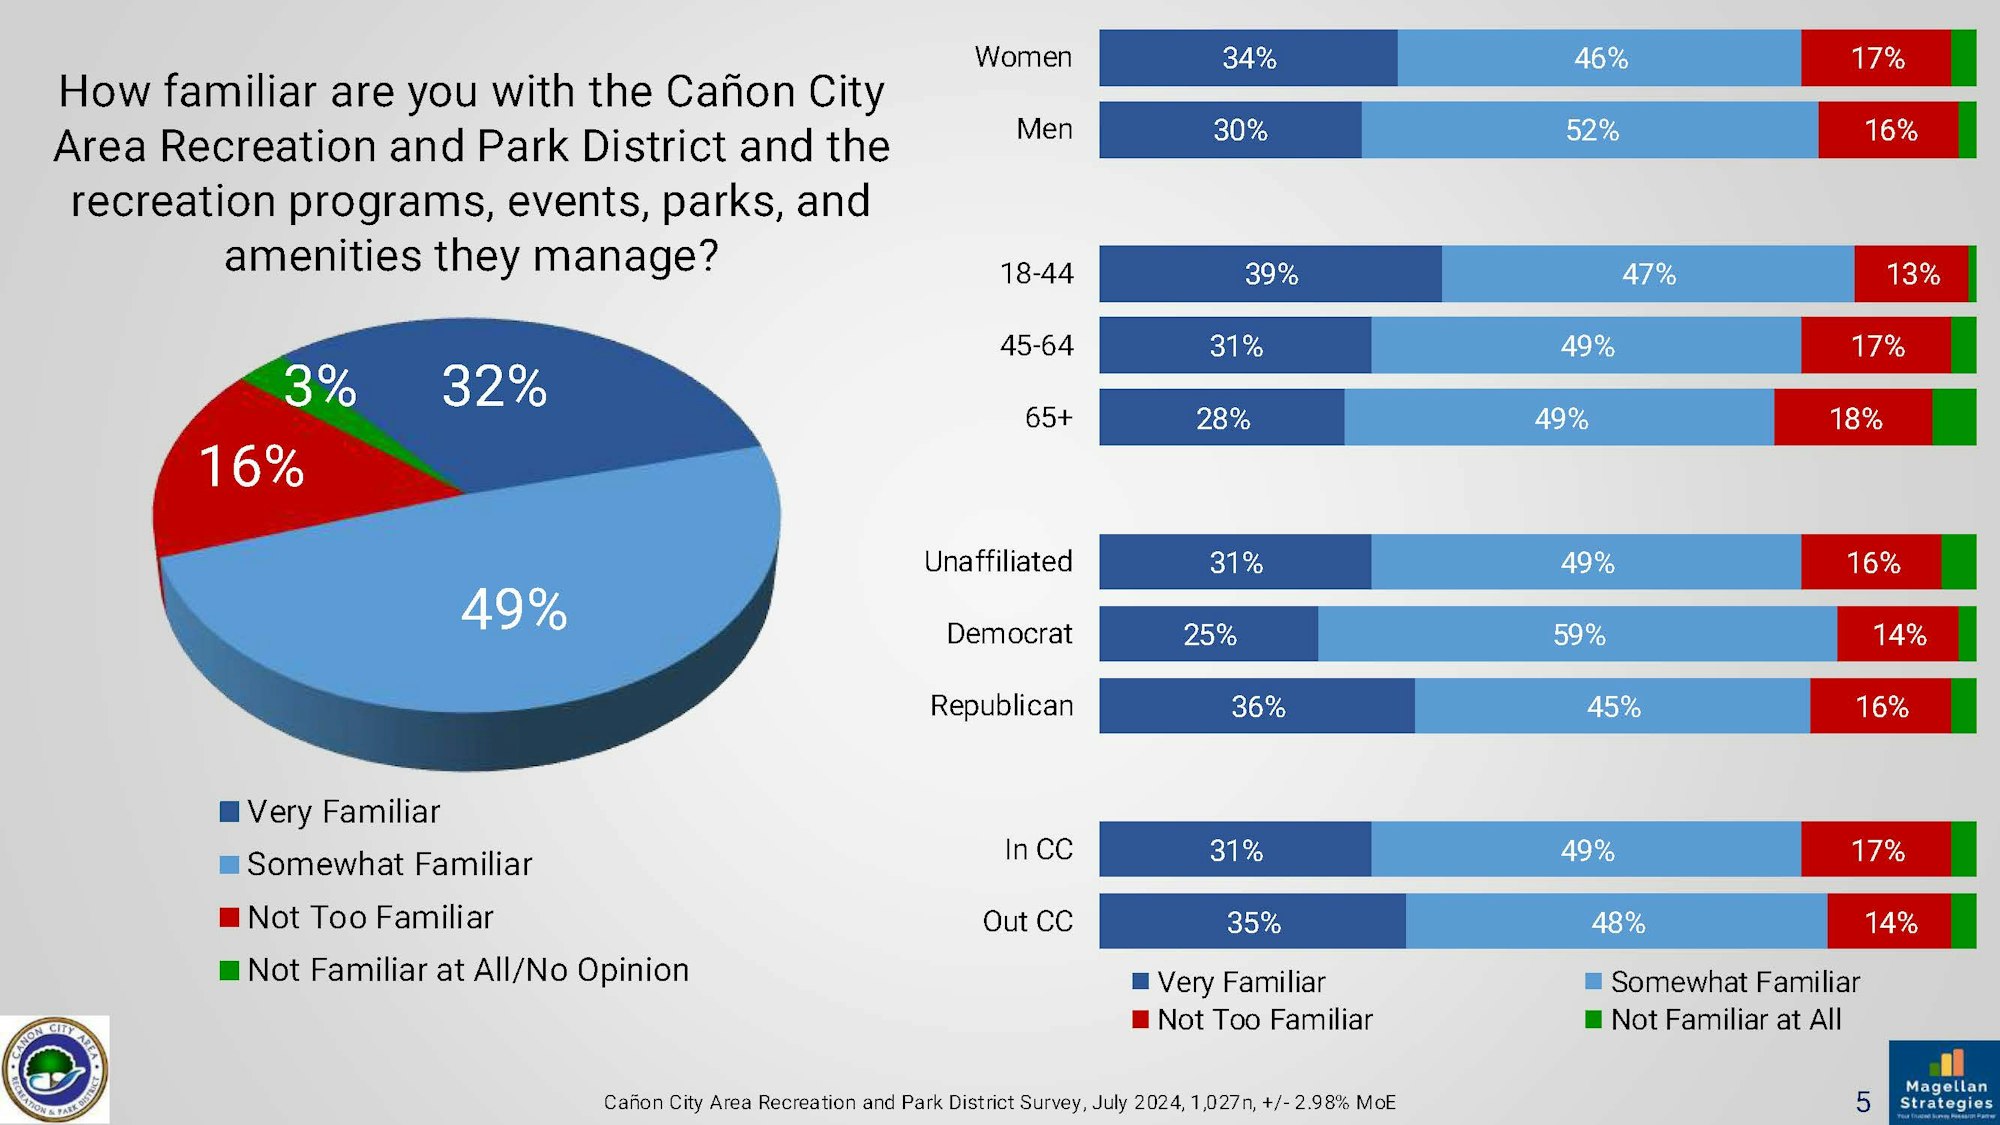
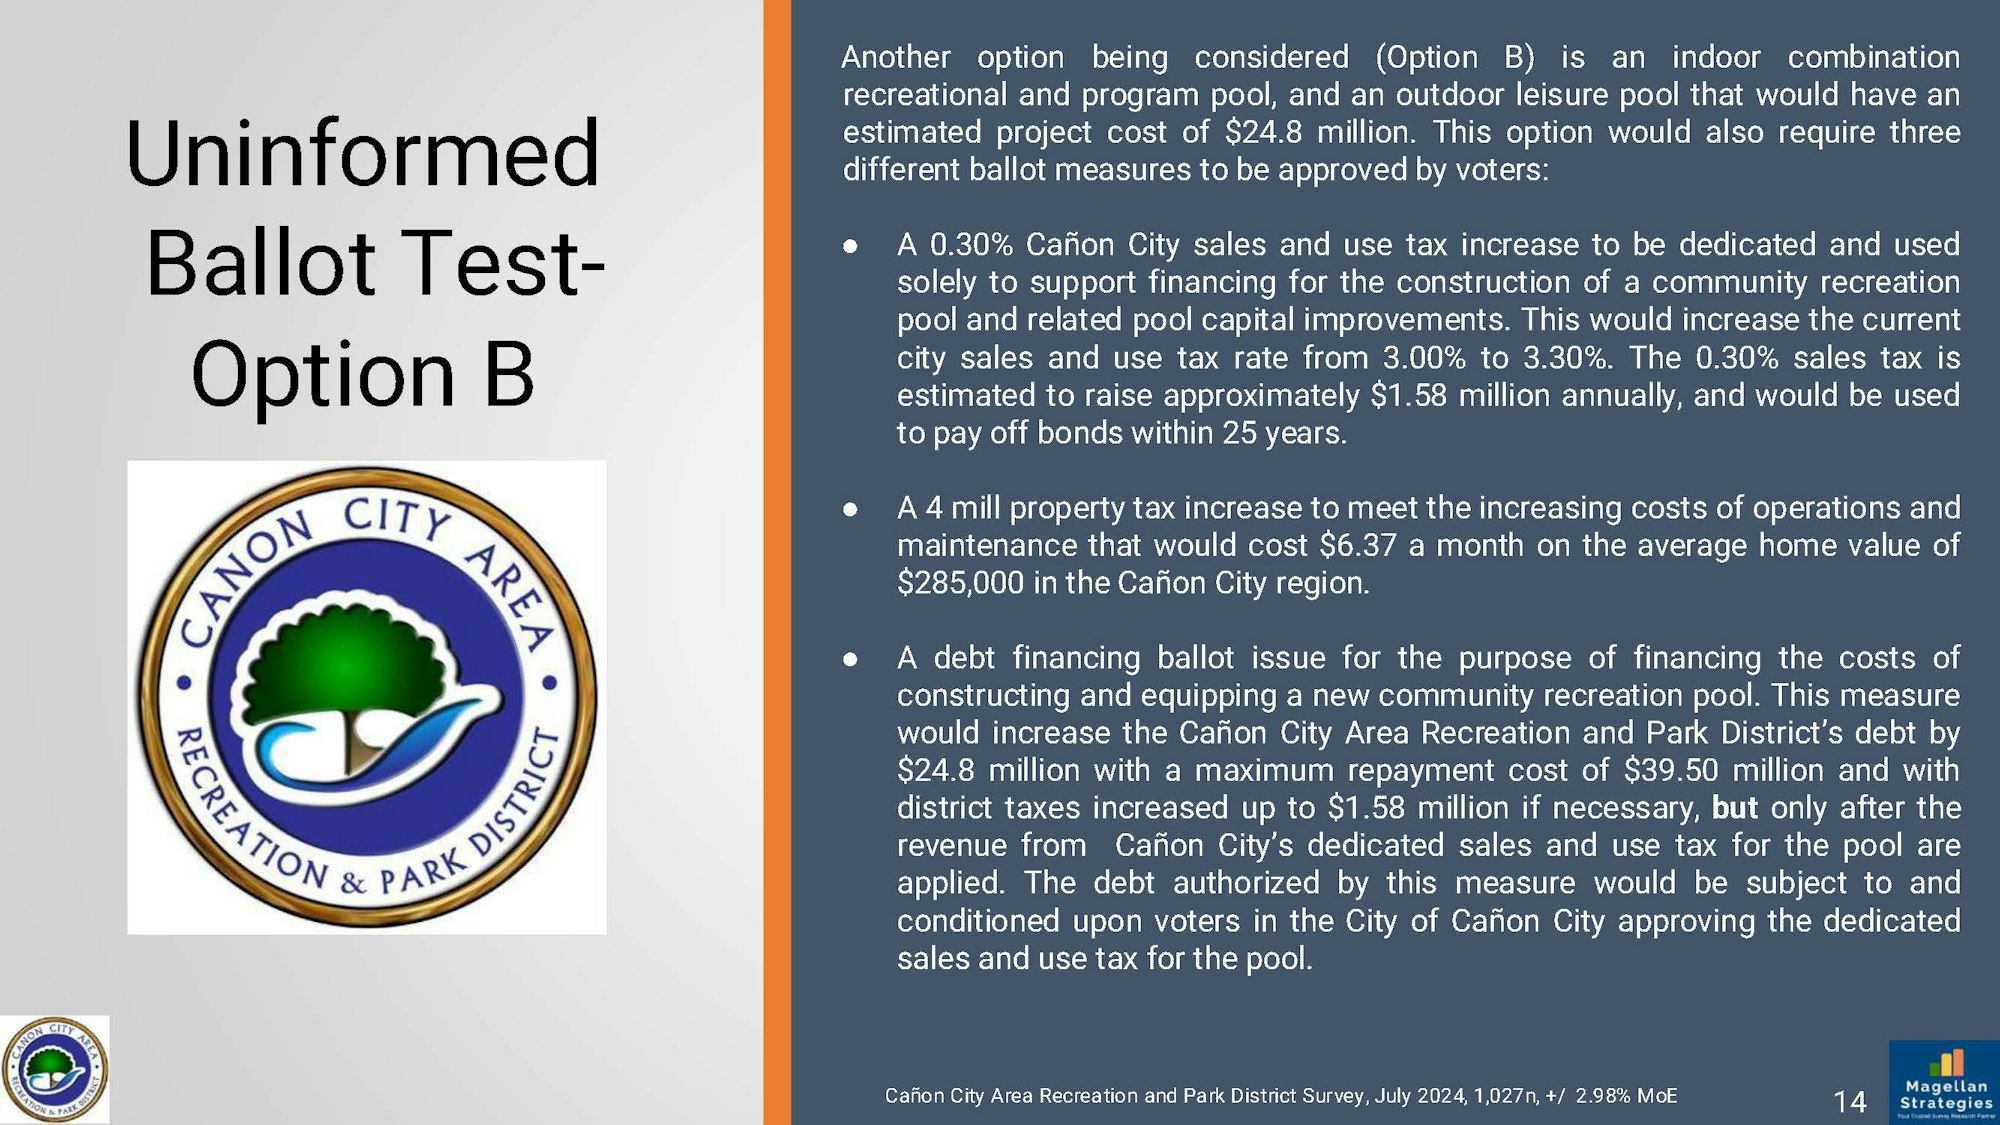
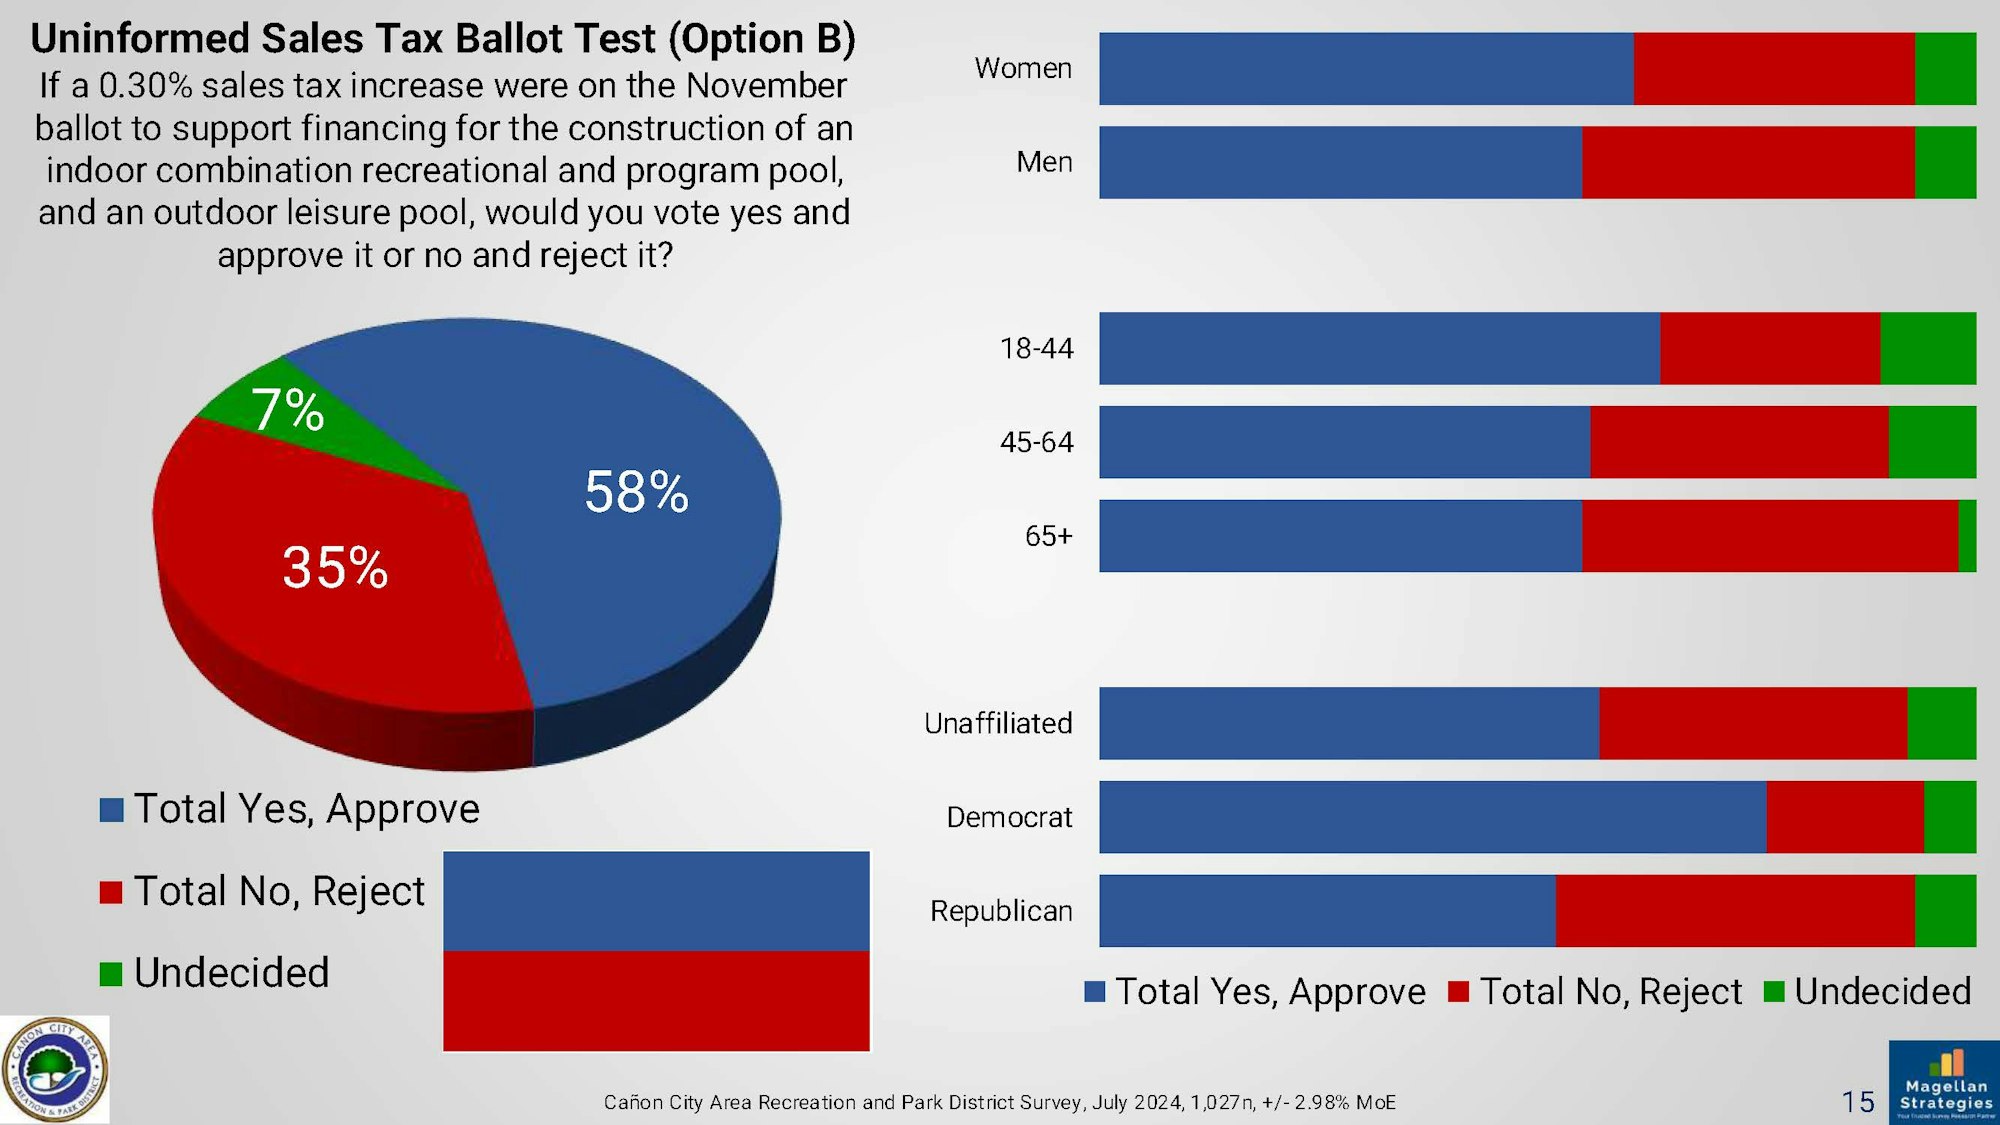
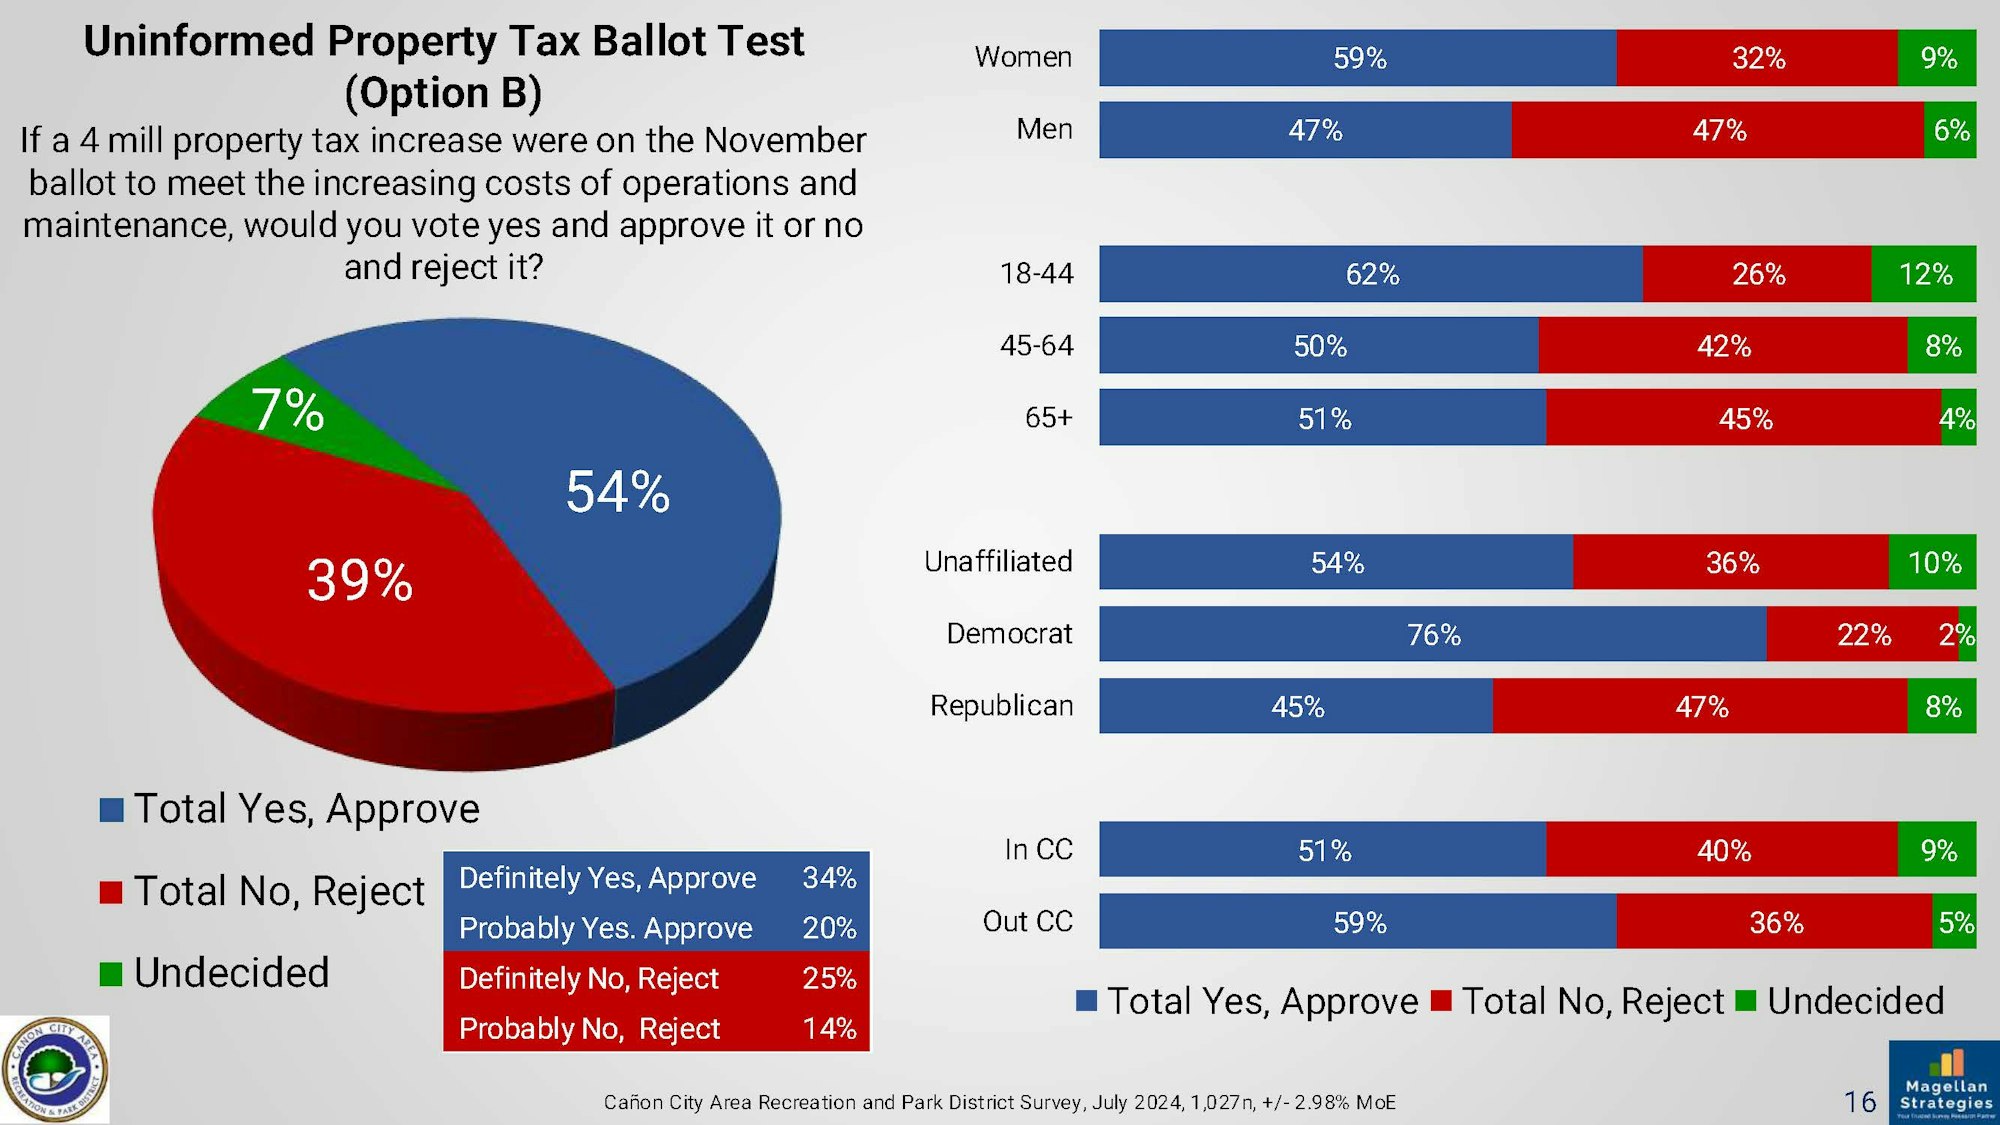
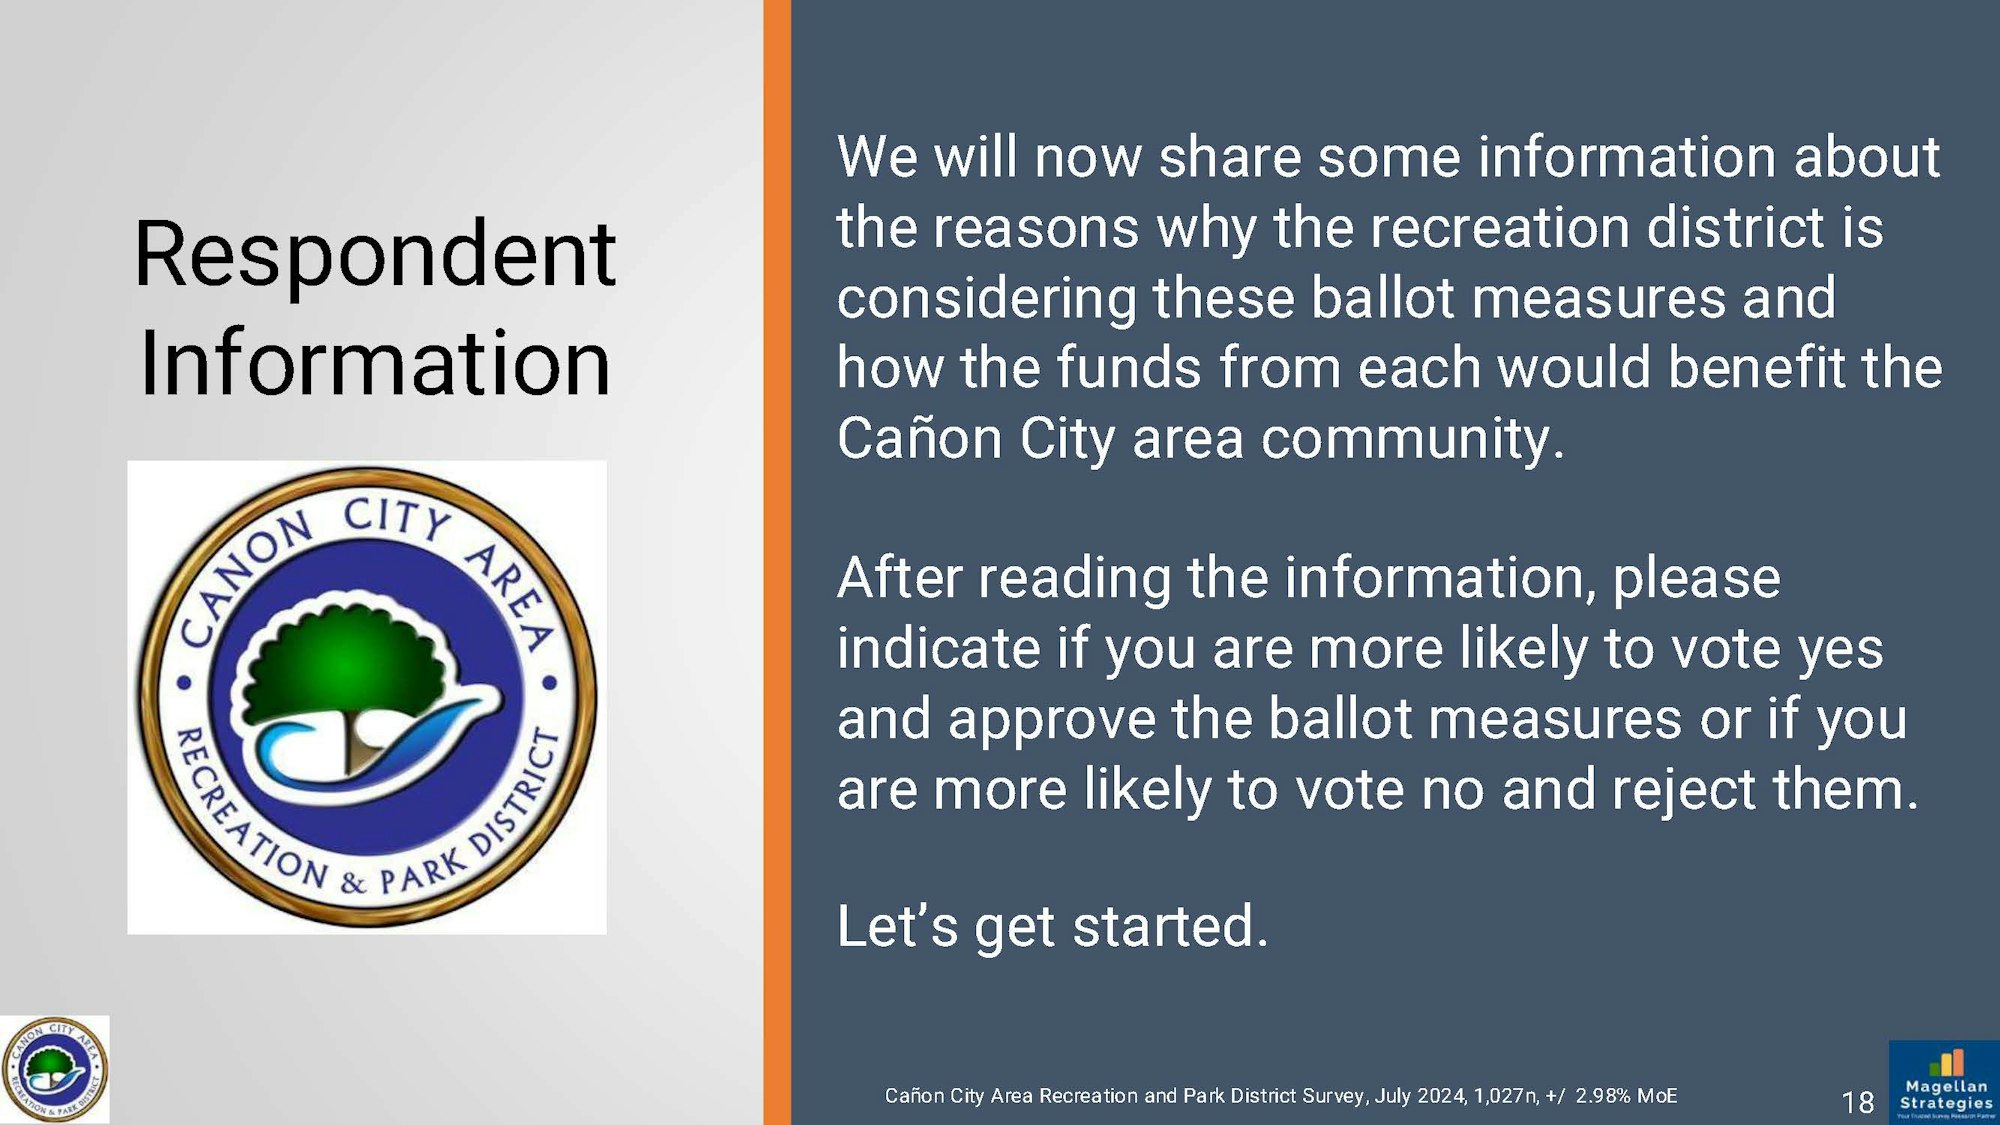
Below are images of the report from Magellan Strategies. It includes the results from the questions about the Recreation District, the selected pool option, and the demographics. Feel free to scroll through the images to read the final report.